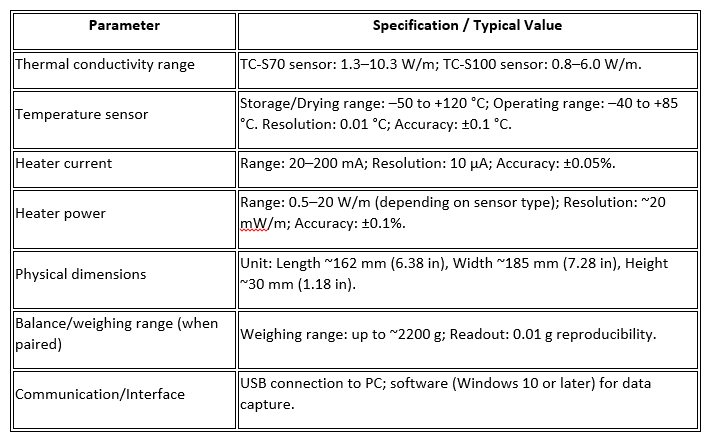
VARIOS Automated Thermal Dryout Curves
The VARIOS system from METER Group is a laboratory instrument designed for the automated generation of thermal¬dry-out curves—that is, measuring how thermal conductivity (or thermal resistivity) of a soil or other porous medium changes as it dries.
Traditionally, constructing a thermal dry-out curve has been labor-intensive: large sample preparation, repeated weighing, manual measurement of thermal properties, lots of manual data-entry and curve-fitting. The VARIOS simplifies this by combining continuous weight measurement (to track moisture loss) with thermal conductivity measurements at intervals (while the sample dries) and automated software analysis.
It supports two measurement modes (continuous or point-by-point) and is compliant with major industry standards such as IEEE 442 2017 and ASTM D5334.
This makes it especially useful for labs doing soil-thermal research, underground cable backfill/soil thermal resistivity studies, geotechnical/hydrogeological research where moisture changes influence heat transfer, and more.
Key Feature
- • Automated measurement: the instrument handles thermal conductivity readings while moisture loss is tracked, reducing manual effort.
- • Continuous, precise weight measurements enabling direct correlation between soil water content and thermal conductivity/resistivity.
- • Dual measurement modes: continuous monitoring or point-by-point (user selects intervals).
- • Space-saving design and ability to measure smaller samples compared with some older systems.
- • Built-in software for data acquisition, evaluation and curve-fitting; aims to minimize human error and streamline workflow.
- • Compliant with major standards (IEEE 442-2017, ASTM D5334), uses the transient line heat-source method for thermal conductivity measurement.
- • High measurement accuracy: temperature sensor resolution 0.01 °C, accuracy ±0.1 °C; heating power and current control.
Technical Specifications
Applications /Usage Areas
- • Soil science research: studying how thermal conductivity/resistivity changes as soils dry (important for soil thermal behaviour, energy exchange, etc.).
- • Underground cable/backfill design: understanding how drying of soil/backfill around buried cables impacts thermal resistivity and heat dissipation.
- • Geotechnical & environmental investigations: monitoring the drying of soils/leachates, landfill cover systems, materials whose heat transfer changes with moisture content.
- • Laboratory characterisation of porous media, composites or building materials: for research where moisture-thermal interactions matter.
- • Research labs needing automated, high resolution thermal dry-out curves with less manual workload.
Benefits /User Advantages
- • Significantly reduces manual steps (weighing, thermal testing, data logging) → saves time and reduces human error.
- • High-resolution curves: hundreds of data points correlate water content change and thermal conductivity change automatically.
- • Versatile measurement: can adapt heating power/time, sample size, measurement mode to specific application.
- • Supports high accuracy and repeatability—good for research/quality control environments.
- • Device footprint is relatively compact for the capability.
- • Provides critical thermal-hydraulic property data that many labs previously did not measure or had to approximate.
Best Practice & Considerations
- • Sample preparation is still important: although the device automates measurement, ensure sample is properly saturated (or initial condition defined) and placed correctly on the system.
- • Maintain good thermal contact between the sensor (needle) and the sample; avoid air gaps or improper insertion which may bias results.
- • Monitor and control ambient environment: although system automates temperature drift correction, stable lab environment will improve accuracy.
- • Ensure software/firmware is updated and calibrated; periodic verification of sensors (thermal conductivity sensor, balance weight, temperature sensor) is advisable.
- • Understand that results (thermal conductivity vs moisture) are specific to sample material, density, texture; interpreting the curves requires domain knowledge.
- • For transition to field implications: remember that lab conditions (dry out, controlled heating) may differ from in-field drying and heat transfer behaviour—use accordingly.
- • When producing reports for design (e.g., cable backfill), ensure you note the water content at which thermal properties were measured, sample density, and context of dryout curve.

 CALL US
 WHATSAPP
 LOCATION